Part of the communications architecture for this research project I’m working on depends on TTL (time-to-live) of data as it travels through various networks.
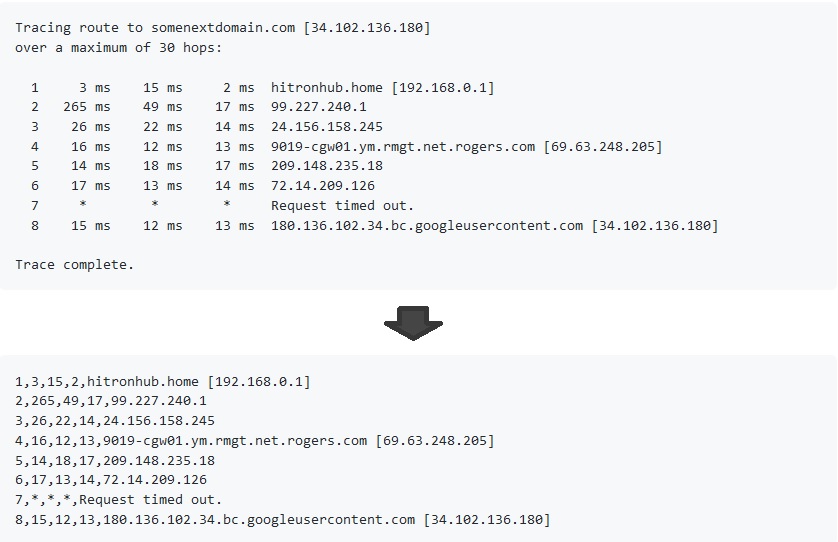
tracert is the perfect tool for such an application; it’s just a shame that there’s no friendly way to generate and output analytics-ready data.
Tracing route to somenextdomain.com [34.102.136.180]
over a maximum of 30 hops:

  1     3 ms    15 ms     2 ms  hitronhub.home [192.168.0.1]
  2   265 ms    49 ms    17 ms  99.227.240.1
  3    26 ms    22 ms    14 ms  24.156.158.245
  4    16 ms    12 ms    13 ms  9019-cgw01.ym.rmgt.net.rogers.com [69.63.248.205]
  5    14 ms    18 ms    17 ms  209.148.235.18
  6    17 ms    13 ms    14 ms  72.14.209.126
  7     *        *        *     Request timed out.
  8    15 ms    12 ms    13 ms  180.136.102.34.bc.googleusercontent.com [34.102.136.180]

Trace complete.
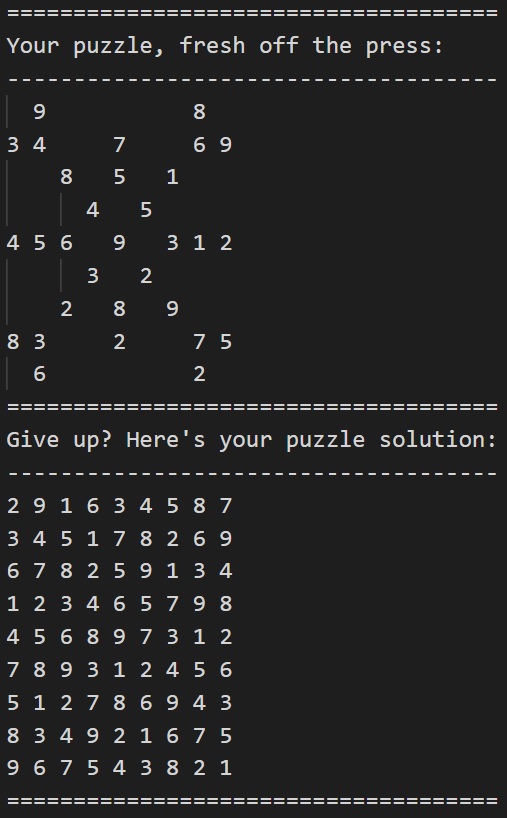
sudoku_api is a pure dart package which simplifies the generation, interaction, and management of Sudoku Puzzles.
Well, how does it do that?
Contains a Built-in solver for generating new puzzles, or solving existing ones
Utilizes and exposes event streams for grid interactions (e.g. cell value changed), and puzzle states
Exposes a bunch of neat, easy to use models manipulating Cells, Positions, Grids, and even Patterns of a Sudoku puzzle
Whoah that sounds pretty cool – but what’s this ‘sue dough que’ you keep talking about?
Sudoku is a logic-based, combinatorial number-placement puzzle. The objective is to fill a 9×9 grid with digits so that each column, each row, and each of the nine 3×3 subgrids (segments) that compose the grid contain all of the digits from 1 to 9. The puzzle setter provides a partially completed grid, which for a well-posed puzzle has a single solution.
Wikipedia
Let’s see some sample code
import 'package:sudoku_api/Puzzle.dart';

void main() {

  PuzzleOptions puzzleOptions = new PuzzleOptions(patternName: "winter");

  Puzzle puzzle = new Puzzle(puzzleOptions);

    puzzle.generate().then((_) {
      print("=====================================");
      print("Your puzzle, fresh off the press:");
      print("-------------------------------------");
      printGrid(puzzle.board());
      print("=====================================");
      print("Give up? Here's your puzzle solution:");
      print("-------------------------------------");
      printGrid(puzzle.solvedBoard());
      print("=====================================");
    });
}
Inspiration
I’ve mentioned a few years ago that one of the first games I completed, 100%, was Brain Age Sudoku on the DSi. I really loved the simplicity and clean, non-bloated interface.
Flash forward a few years, and I still haven’t found an app that gives me the same feel.
My goal is to develop a highly customizable, clean, and easy to use Sudoku Toolkit in Flutter using this API – and perhaps encourage others to do the same.
A solid chunk of logic was re-used (namely, solving) from a previous project in college; Java Sudoku. The rest was an experiment in developing a dart package for the first time.
Creating a health dashboard by hacking intelligence into an AOpen (the ‘A’ for ancient) monitor; with metrics aggregated by Graphite and beautifully displayed with Grafana.
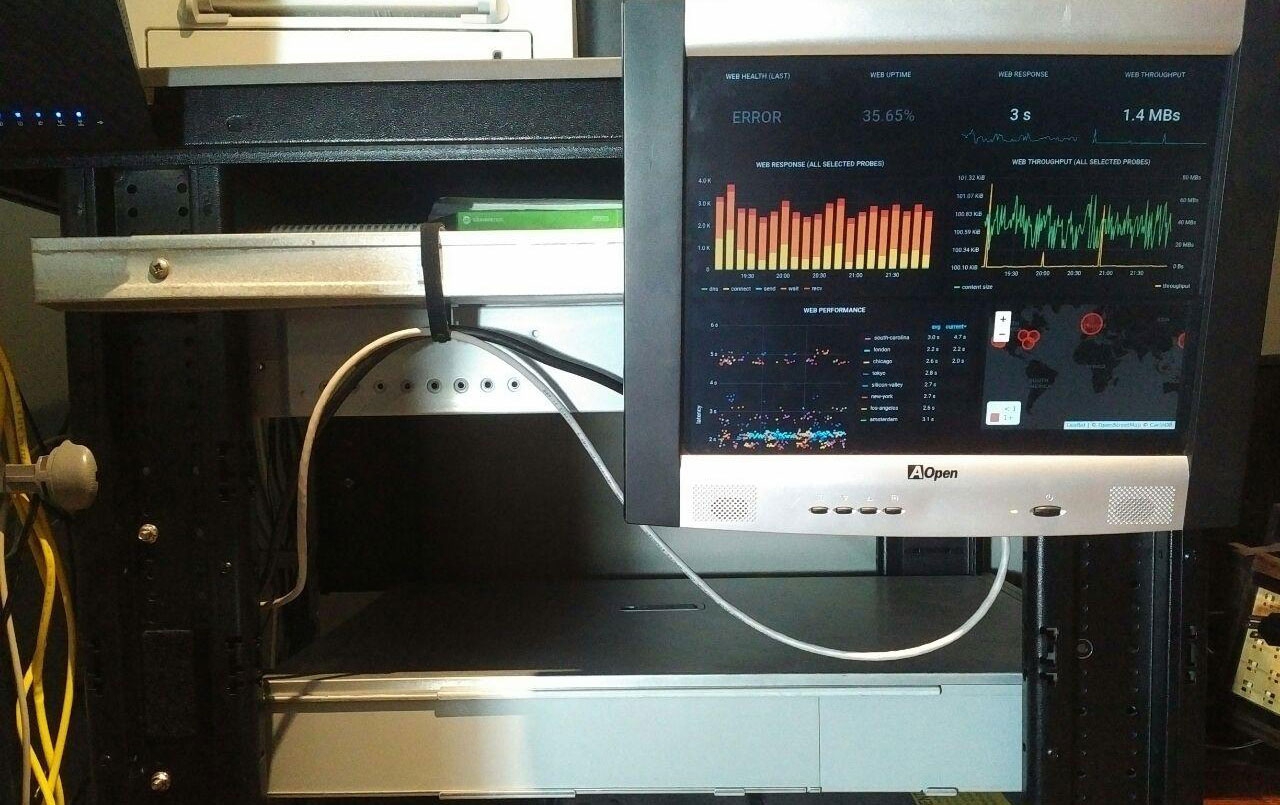
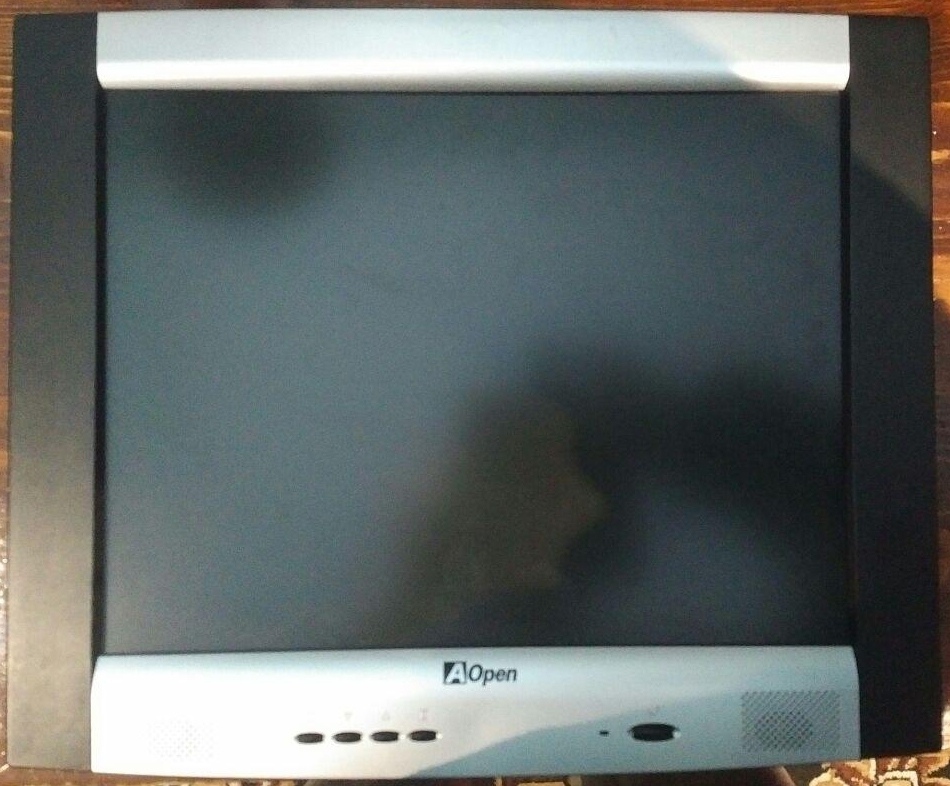
Front of GraPi Kiosk
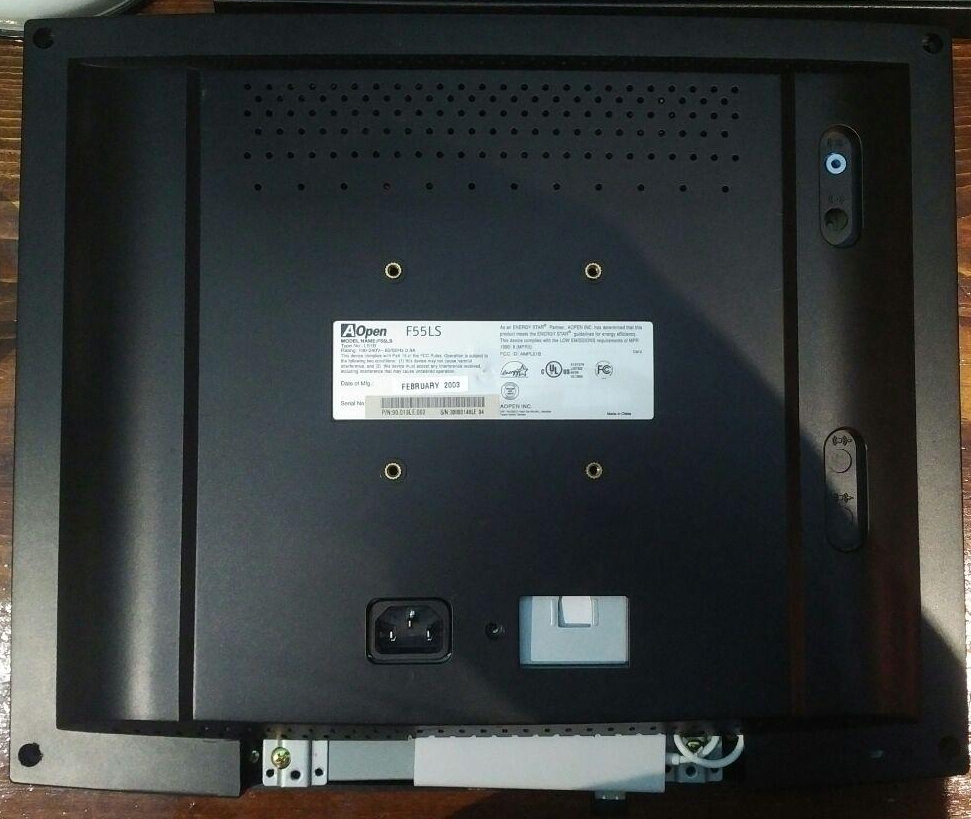
Rear of GraPi Kiosk – note there’s only two connections needed; power and Ethernet
Mounted on a horizontal sliding rail, cables temporarily strung up with Velcro
This marks the completion of hardware needed for the GraPi system – our AOpen monitor now functioning as a smart Kiosk.
Minor mishap; realized at the end that the USB/Ethernet Hub’s mounting orientation results in the Ethernet port to the RIGHT of the monitor rather than the left. However, I’m planning to hide these cables within the rail, so once the Ethernet cable gets pulled behind the monitor, it shouldn’t be noticeable.
You might be able to notice from the images above, but we do have a working Graphite & Grafana setup running – something I’ve been working on alongside all this, and will be discussing in the future. The metrics seen are an example, with data from WorldPing targeting a friend’s server in the states – the purpose being to illustrate a loaded Grafana dashboard.
From here on out, it’s all software.
In the next few posts, we’ll cover setup of Graphite and Grafana on Ubuntu Server, followed by setting up a Grafana dashboard kiosk on Raspbian Lite.
Creating a health dashboard by hacking intelligence into an AOpen (the ‘A’ for ancient) monitor; with metrics aggregated by Graphite and beautifully displayed with Grafana.
I’d like to say that the build went on without a hitch, but I ran into two issues. Not project critical issues, but troublesome nonetheless.
Let’s talk about them, and how I’ve managed to successfully resolve some dastardly slow performance, and fail to resolve high static audio issues.
Troubleshooting poor processing performance
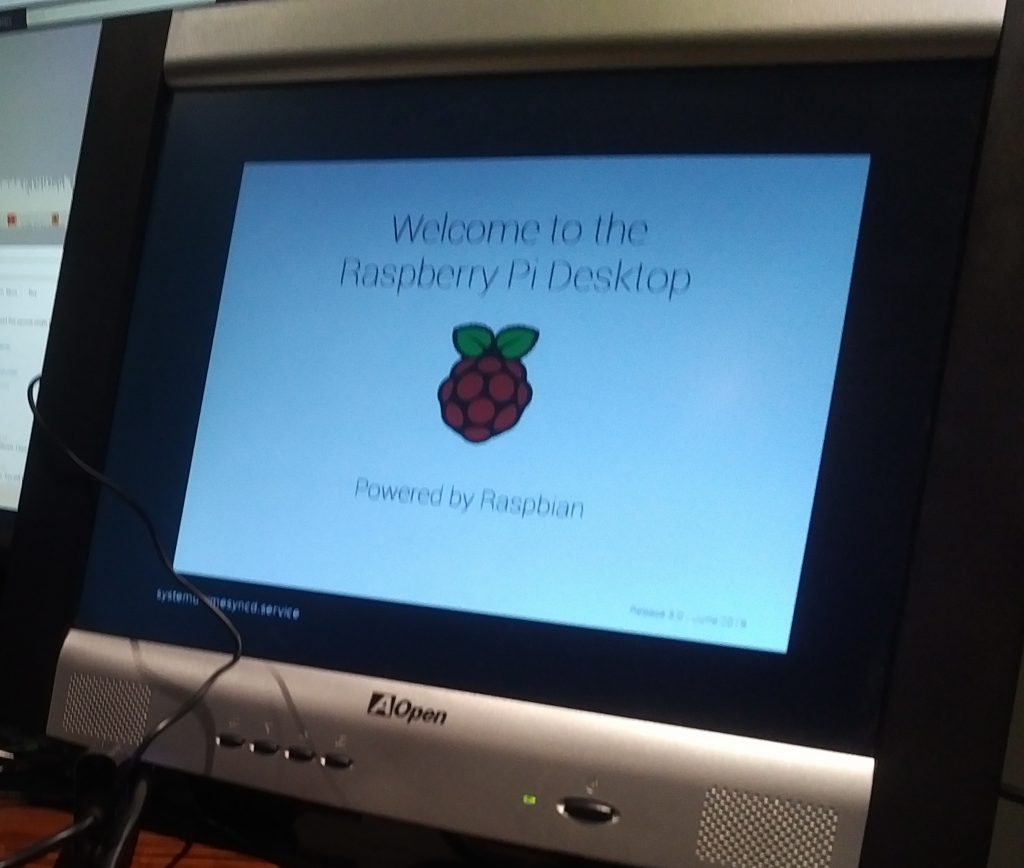
Super excited to get the system going, I dd’d Rasbian Buster (desktop) onto a 16 GB card, and completed setup for my Pi Zero.
Immediately after boot, I noticed how sluggish the system was. Some symptoms I’ve experienced include:
Desktop environment input lag (mouse movement, key presses)
Long time to load applications
SSH authentication takes abnormally long (reached 10 seconds at one point)
SCPing at a rate of 10 kb/s over Ethernet
CPU always at 100% utilization
Half of me thought it had something to do with my configuration. However, these symptoms were prevalent since the first boot into Raspbian. Furthermore, a majority of my configuration was network related, nothing that would cripple other system components.
The other half of me thought it had to do with my Pi Zero. I’ve done some reading online and found others also experiencing poor system performance with Raspbian Buster (desktop) on the Pi Zero. Perhaps a full desktop environment image of Raspbian was asking too much?
Well, I didn’t let that stop me, and took to exploring a wide breadth of light-weight OSes for the Pi, including PiCore, Raspup, and DietPi.
I’ve wiped this MicroSD card enough times to give it an identity crisis.
I eventually got tired of testing out different distributions, and defaulted over to Raspbian Buster Lite, where I installed LXDE along with Midori, Epiphany, and Chromium to decide which would serve as my kiosk browser. The final image after setup served to be the most responsive but browsing a single page was still taking forever (>60 seconds to load alvinr.ca) – and even then, the load wasn’t complete.
The more numbers I put together, the stranger the situation looked. It was here when I put software aside, and started looking at some hardware specifications
The Pi Zero runs a 1GHz single-core CPU with 512MB RAM. My CPU utilization on a fresh installation of Raspbian Lite was always near 100%, while RAM usage on my own image never exceeded ~200 MB.
The entire unit remains quite cool while operating, barely deviating from room temperature – it wasn’t like I was giving it a reason to, nor the means to with a 5V/1A supply.
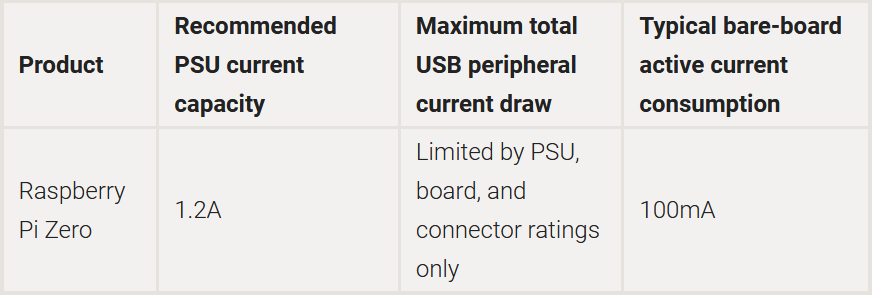
Taking a look at the power requirements for the Pi Zero made me realize I was using a supply below recommended. This was taking into account my ‘desktop’ setup, with a USB/Ethernet hub housing a wireless keyboard/mouse dongle.
Could it be? The Pi was throttling CPU to prevent brownout?
I’m telling you – if there’s anything I’ve learned as a FIRST alumni from 4 years of competitive FIRST Robotics, it’s to know your power draw, and always charge your damn batteries.
As for our system here, we know the power draw. Some further research for the Raspberry Pi yielded the following documentation – recommending a supply of 2.5A.
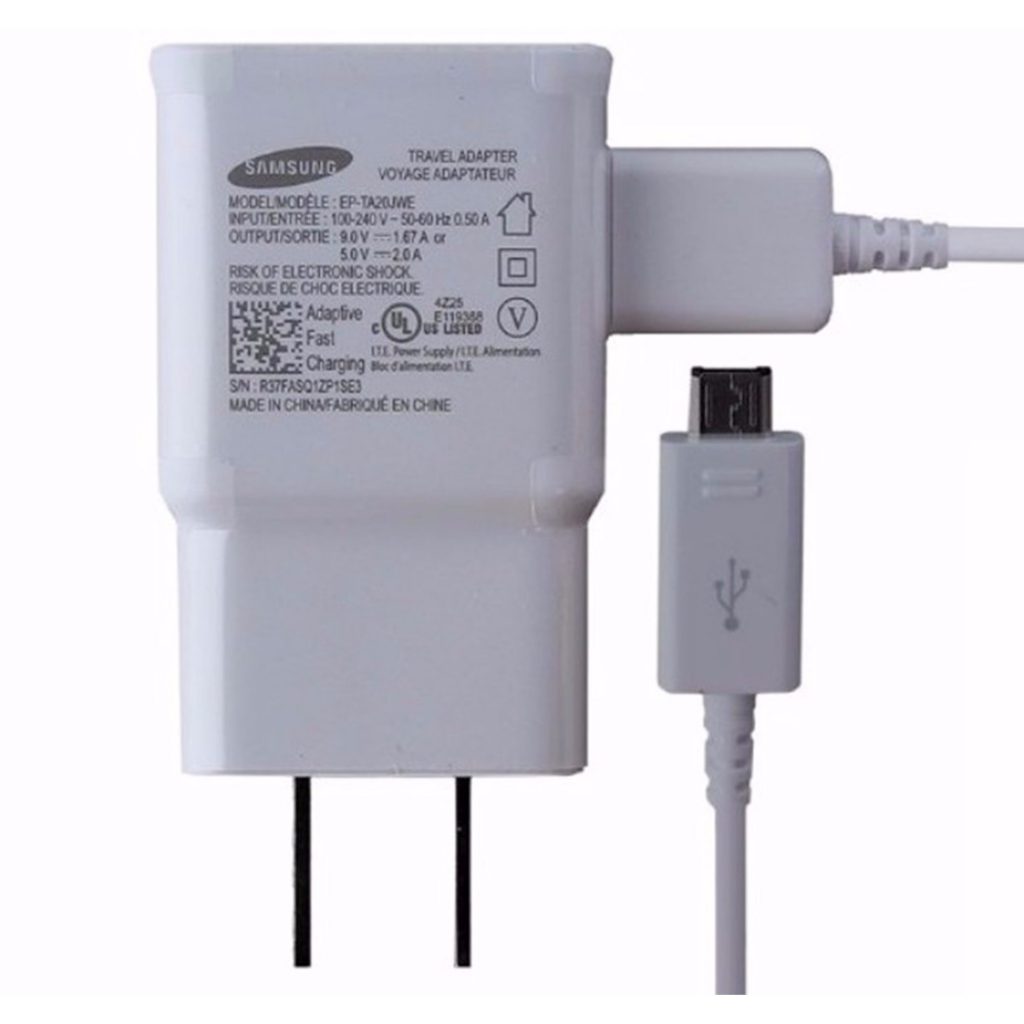
I’ve got something close enough – a Samsung S7 5V/2A charger. I swear, if I plug in this supply and it turns out that was the problem all along…
Well.
After an hour of playing around with it (and several sanity-driven reboots later), I now experience U N P A R A L L E L E D performance. Really though, performance has improved drastically.
CPU utilization with Chromium running sits at around 60%, and it only takes 20 seconds to complete load alvinr.ca. Network performance was better as well, managing to perform an SCP transfer at ~8 MBps – close enough to the 10/100 Ethernet adapter capabilities.
All that’s left now is to replace the existing 5V/1A adapter with this one.
Before; featuring the 5V/1A generic USB power supply I’ve got from god knows where…
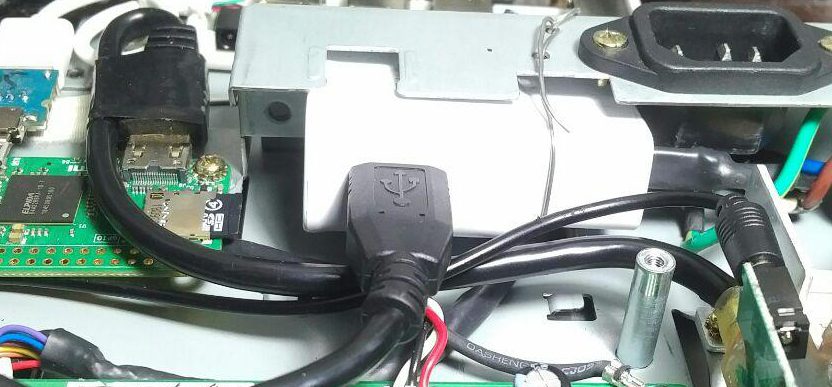
After; featuring the S7’s 5V/2A power supply secured down with wire
Sweet – let’s move on.
Troubleshooting high static on the Raspberry Pi
It’s the end of the final assembly – we’ve got a better power supply, wires and components have been neatly organized, and everything is secured down.
I couldn’t even make it 10 seconds in – the sound was absolutely jarring, a rough mix of tones and high static.
Audio recording of the playback of the first ~30 seconds of Anson Seabra’s ‘Love The Way You Lie’ cover
Not the song mind you – I’ve definitely broke something along the way.
Let’s get this out of the way – I haven’t resolved this yet, nor have I pinned down an exact cause. I’m moving forward with the project, considering all the time invested into troubleshooting (and since audio was an optional feature).
However, if you manage to run into something similar, here are some things I’ve tried:
Re-seat connectors
Use a shielded vs. non-shielded AUX cable
Ground Raspberry PI
Different audio output device
Different audio track, different audio player, even different Linux distros
At the least; I’ve narrowed it down to a hardware fault, either with the Pi, or more likely, the Mini HDMI to VGA adapter (since it splits audio to AUX output).
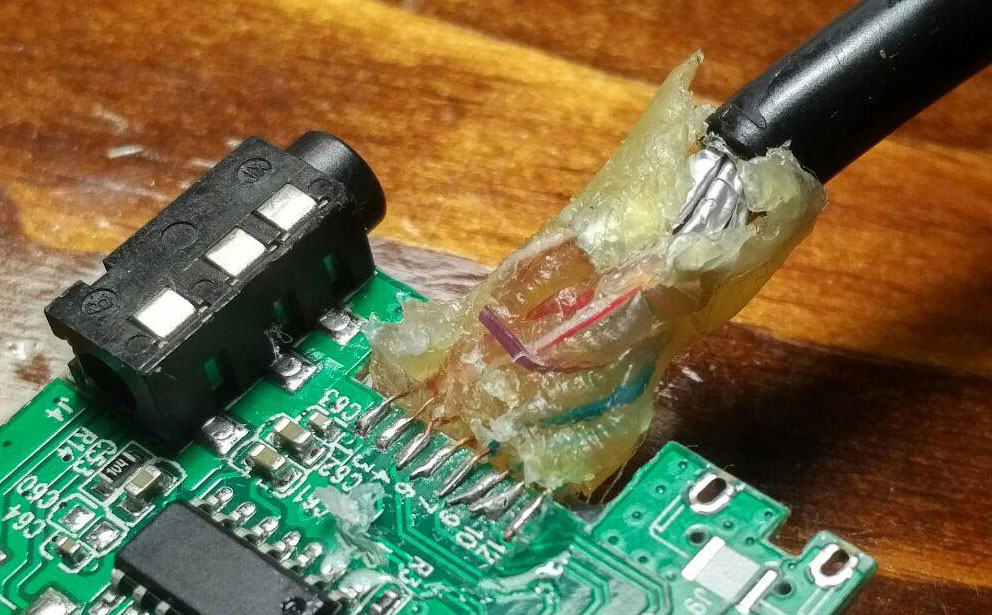
A little light and some hot glue digging eventually led me to finding a possible fault, present in this very adapter.
Small, purple wire disconnected from the main PCB of the Mini HDMI to VGA adapter
While I don’t know what purpose this wire serves, I’ll leave the blame on it for now, until I find the time to either investigate it further, or purchase another adapter.
A journey in extending a ZFS volume pool on a FreeNAS virtual machine after changing vdisk size.
Skip to the procedure section to dig right into it
Background
Virtualizing I/O is perhaps one of the best ways to shoot yourself in the foot. Or IS it?
You’re taking a piece of software of which its very namesake involves large I/O operations, and throwing it behind layers of abstraction. When an I/O request is made from a VM, the hypervisor must both ascertain the source, and gain access to the destination by translating the abstracted storage location to a physical location – all while remaining secure.
Not to mention;
Your I/O heavy VM is contending for bandwidth across an already busy storage driver, to some storage which may also be shared by other VMs.
Furthermore, if you’re not even running a bare metal hypervisor and are using applications such as VMware Workstation or Oracle Virtualbox, then performance degrades further – since your hypervisor is now contending against the host operating system for I/O.
Why then, would one want to virtualize NAS?
As much of a sin this seems to be, there are some clear and powerful benefits to doing so.
Perhaps most obvious, you’re given the flexibility provided by any virtual system; simplified management, accurate hardware performance metrics, and one-click customization should you wish to change CPU/RAM/disks.
This ability to change the size of a VM’s disk is quite trivial. Getting FreeNAS to realize the added space is another story altogether.
Furthermore, there are ways to eliminate I/O bottlenecks by using PCI pass through, giving VM access to raw disk. Do note that certain hypervisor features are unavailable when doing so – taking VMware for example, where you will lose fault tolerance, HA, DRS, snapshots, and a few more.
And then there’s laziness factor; why go through the effort of setting up a whole new, dedicated machine just for NAS when I can just spin up a FreeNAS instance in minutes?
My use case is personal, and while certain pros/cons hold true between lab and production environments, research is key in determining whether NAS virtualization is best for you.
Procedure – Extending FreeNAS Pool Size after vDisk size change
When you increase the size of a virtual disk, it’s up to guest to resize/grow partitions to utilize the free space. This is what the following procedure will cover; how to properly resize a volume after changing one of its disks’ dimensions – and having FreeNAS update pool size accordingly. Note that the following procedure applies to FreeNAS 9.2.1 – however, it remains relevant for newer FreeNAS versions.
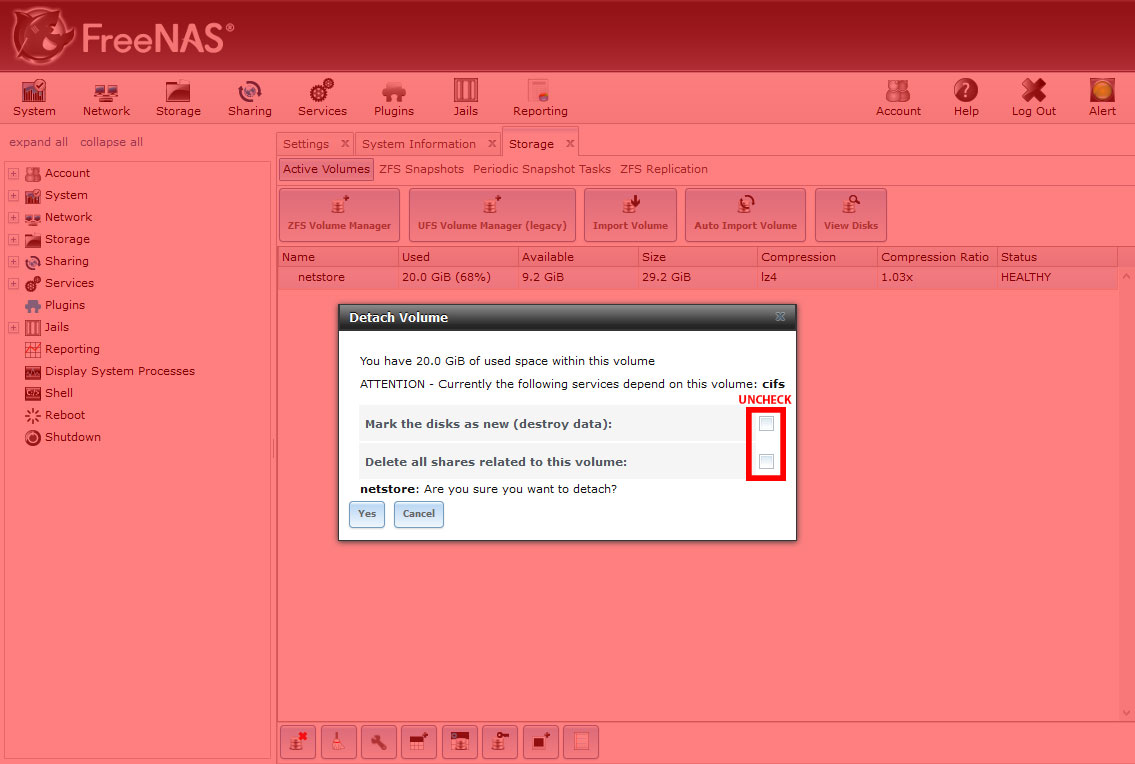
Step 1. Log into webmin, detach the volume being resized
Log into your FreeNAS web administration portal. By detaching this volume, we can safely perform partition changes to disk(s) within. UN-CHECK the destroy data and delete shares options.
Step 2. Shut down FreeNAS
Ensures that there are no lingering locks to this volume and/or its disks before we grow our drive(s).
Step 3. Grow drives
Grow vDisks using whatever means available – vboxmanage, vmkfstools, vmware-vdiskmanager, etc.
Step 4. Power on FreeNAS, and enter shell
Step 5. Enter the following commands in order:
zpool status
Retrieve the name(s) of partitions for each pool. One of these partitions will correlate to the disk(s) expanded. NOTE down the gptid for YOUR pool – we will use this later.
glabel status
Resolves a partition name to drive name (Components column). NOTE down the Components name for the partition identified previously – we will use this later.
gpart resize -i 2 /dev/da0
Replace da0 with drive name (Components name) identified previously. This command will resize the specified disk. On completion, a ‘resize successful’ message is given.
Step 6. Log into webmin, and auto import the pool
On successful auto import, you will see your volume under Storage > Active Volumes
Step 7. Bring device back online and expand pool size
Return back to your FreeNAS shell, and enter this final command to both bring the device online, and automatically update the pool size.
Replace poolname with the component name from zpoolstatus. Replace some-long-gptid with the partition name from glabel status.
The ‘-e’ flag is meant to be used when a smaller disk has been replaced by a larger disk – which to the guest, is what we’ve done.
At this point, you should be able to refresh your webmin and note the changes in used/available/size for your particular volume in Storage > Active Volumes. This of course, will also be reflected in any shares active.
Creating a health dashboard by hacking intelligence into an AOpen (the ‘A’ for ancient) monitor; with metrics aggregated by Graphite and beautifully displayed with Grafana.
As promised, let’s dive into some of the modifications made to Audio Control and USB/Ethernet Hub – all part of the master plan.
Audio Control – Moving Audio IN, INside
With our cheap little Mini HDMI to VGA adapter providing audio output from the Pi, all we need to do is feed it into the monitor. Spoon of choice? AUX cable.
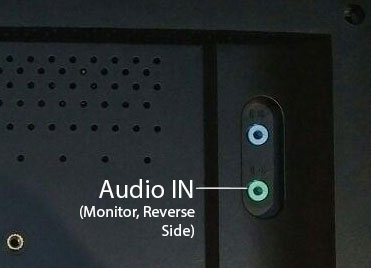
Now here’s where it gets a little awkward. With
the unit closed, Audio IN is facing outwards. Meaning we’d have to lead
an AUX outside the unit and plug it into the back, making this odd
protrusion.
Well, that won’t do. One of the key tenets of this project was to ensure the unit is compact, with as many components encapsulated within the monitor chassis itself.
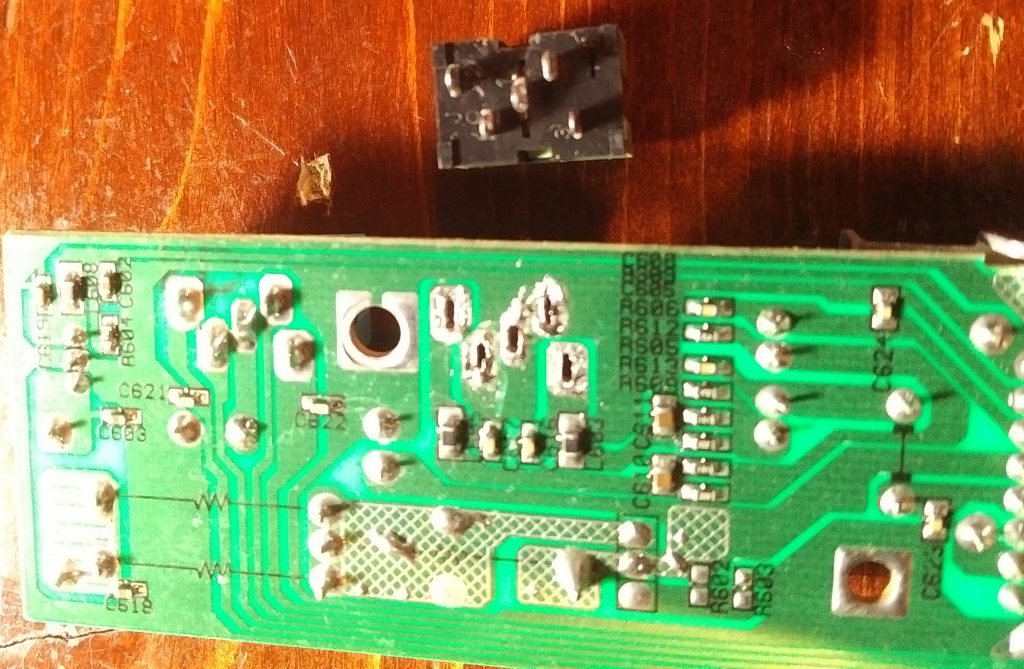
Let’s perform a surgery, and extract the Audio IN (AUX) port and see if we can move it around.
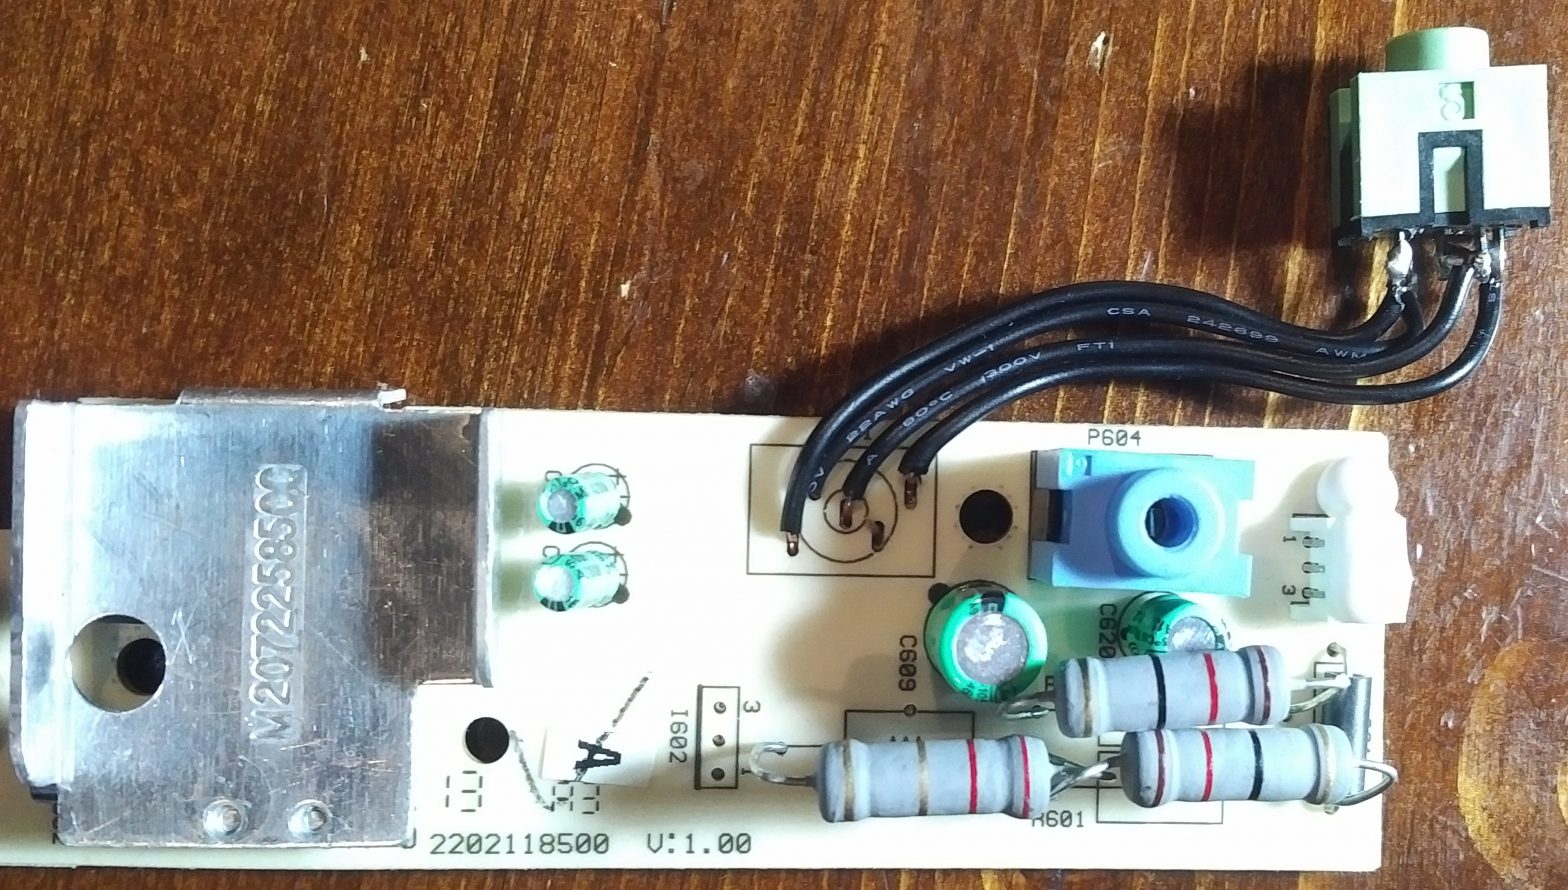
Audio Control board extracted; Audio IN looks pretty isolated, shouldn’t be too difficult to remove the connector from the PCB
Audio IN AUX port extracted, desoldered joints on reverse side of PCB
Added some simple single-conductor wire between the board and Audio IN AUX port so we can change its orientation inwards
And done. Time to test. Powered on the unit, ensured the AUX cable was connected between our Mini HDMI > VGA adapter and Audio IN on the monitor, and basked in the graininess of Do You Rememberremixed by grey.
Yeah, it was pretty bad. Not because of the mod I assure you (having tested audio on this monitor awhile back), more so because the speakers are terrible.
Anyways, won’t be playing music through this anytime soon – any audio coming through the Pi will be for notifications/alarms.
USB/Ethernet Hub – Mounting
Never thought I’d say it, but for once, this modification was made EASIER by the cheap construction of a part.
The Ethernet/Hub adapter easily came apart (surprise), separating away from its case, allowing me to determine a suitable mounting location.
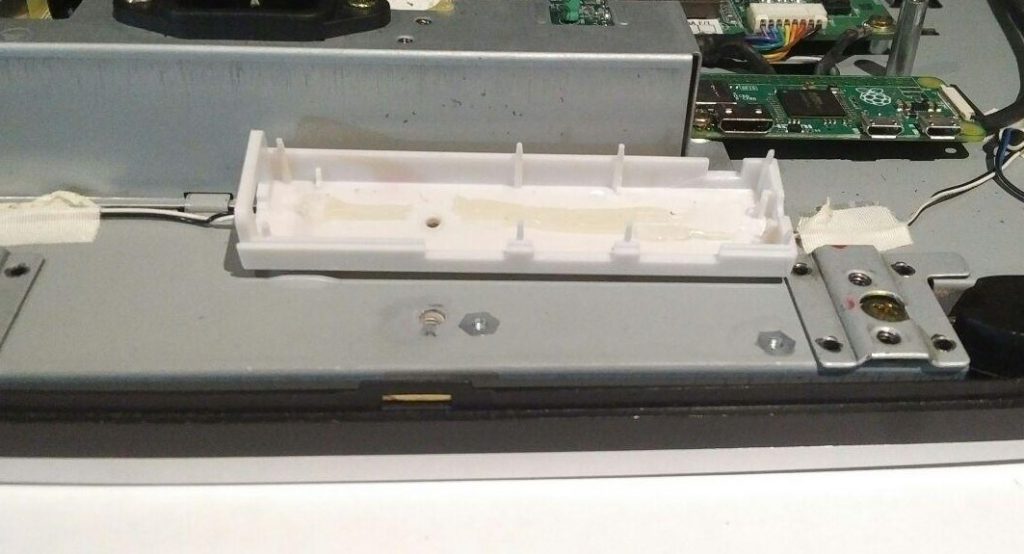
Deciding to mount it near the bottom for both out-of-sight accessibility came with the added bonus of being closer to the Pi. To mount the hub, I ran one of the leftover hinge screws through the lower-half of the plastic hub case, right back into the frame.
All that was left was to cut a portion of the rear cover out to accommodate the area now taken by the hub, and we were good to go.
Lower-half of hub case flushed right against hinge, hole drilled to take advantage of existing threaded hole from the hinge that used to be
Lower half screwed in, hub components and top case half reassembled
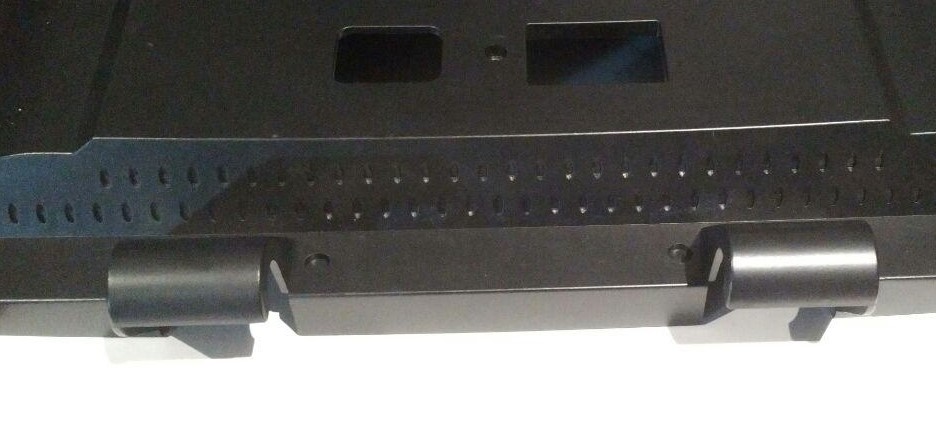
Lower part of the rear cover – originally intended to contain hinge construction, needs to go
Some hacksawing and filing later, we’ve got a notch just for the hub, with enough clearance on the left for ethernet access
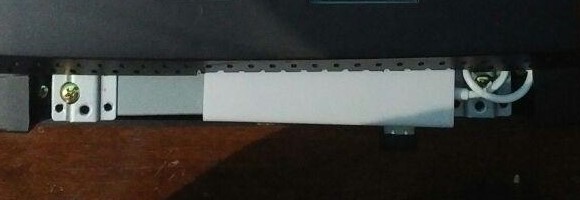
Rear cover assembled! Realized at this point that the hub had a little wiggle room – eventually resolved by adding a screw to the right side
And there we go! This wraps up a majority of the hardware. For now.
The next post will cover assembly in more detail, along with any issues we should consider before side-mounting onto my server rack.
Creating a health dashboard by hacking intelligence into an AOpen (the ‘A’ for ancient) monitor; with metrics aggregated by Graphite and beautifully displayed with Grafana.
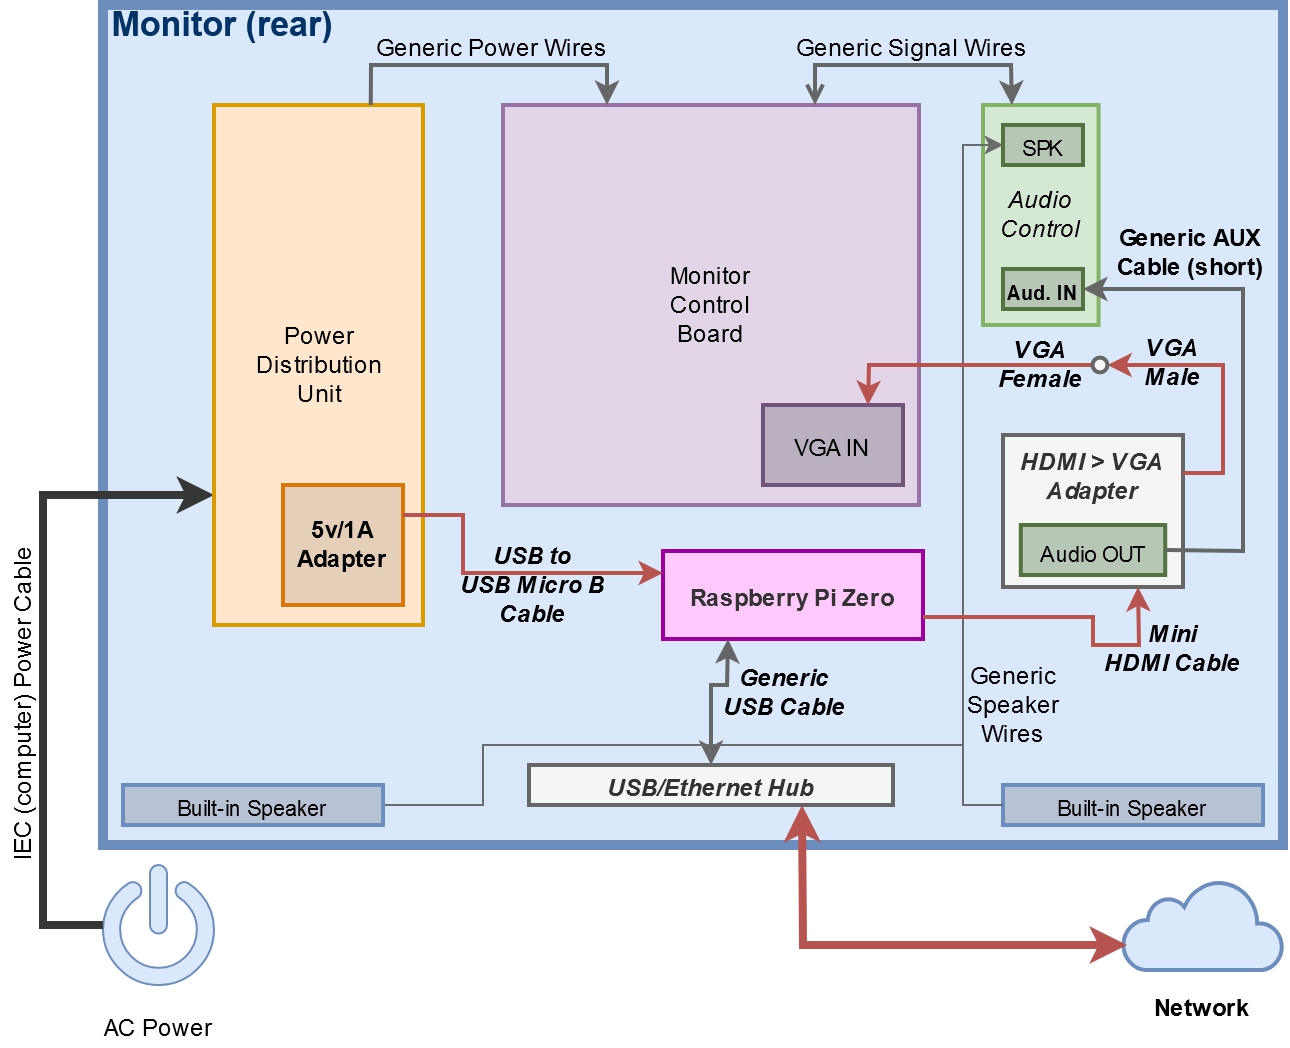
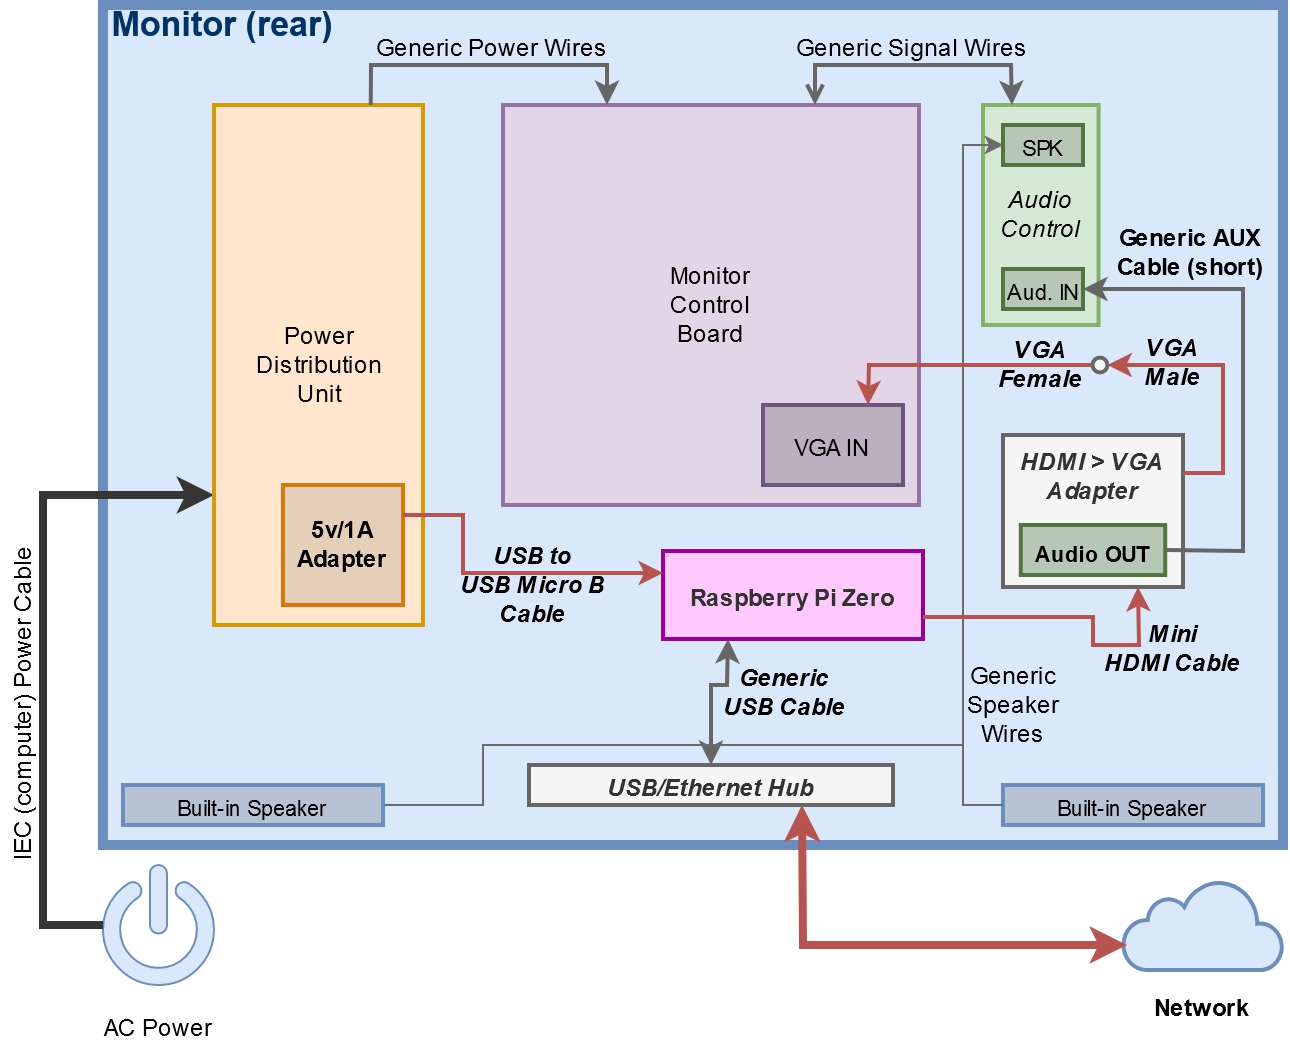
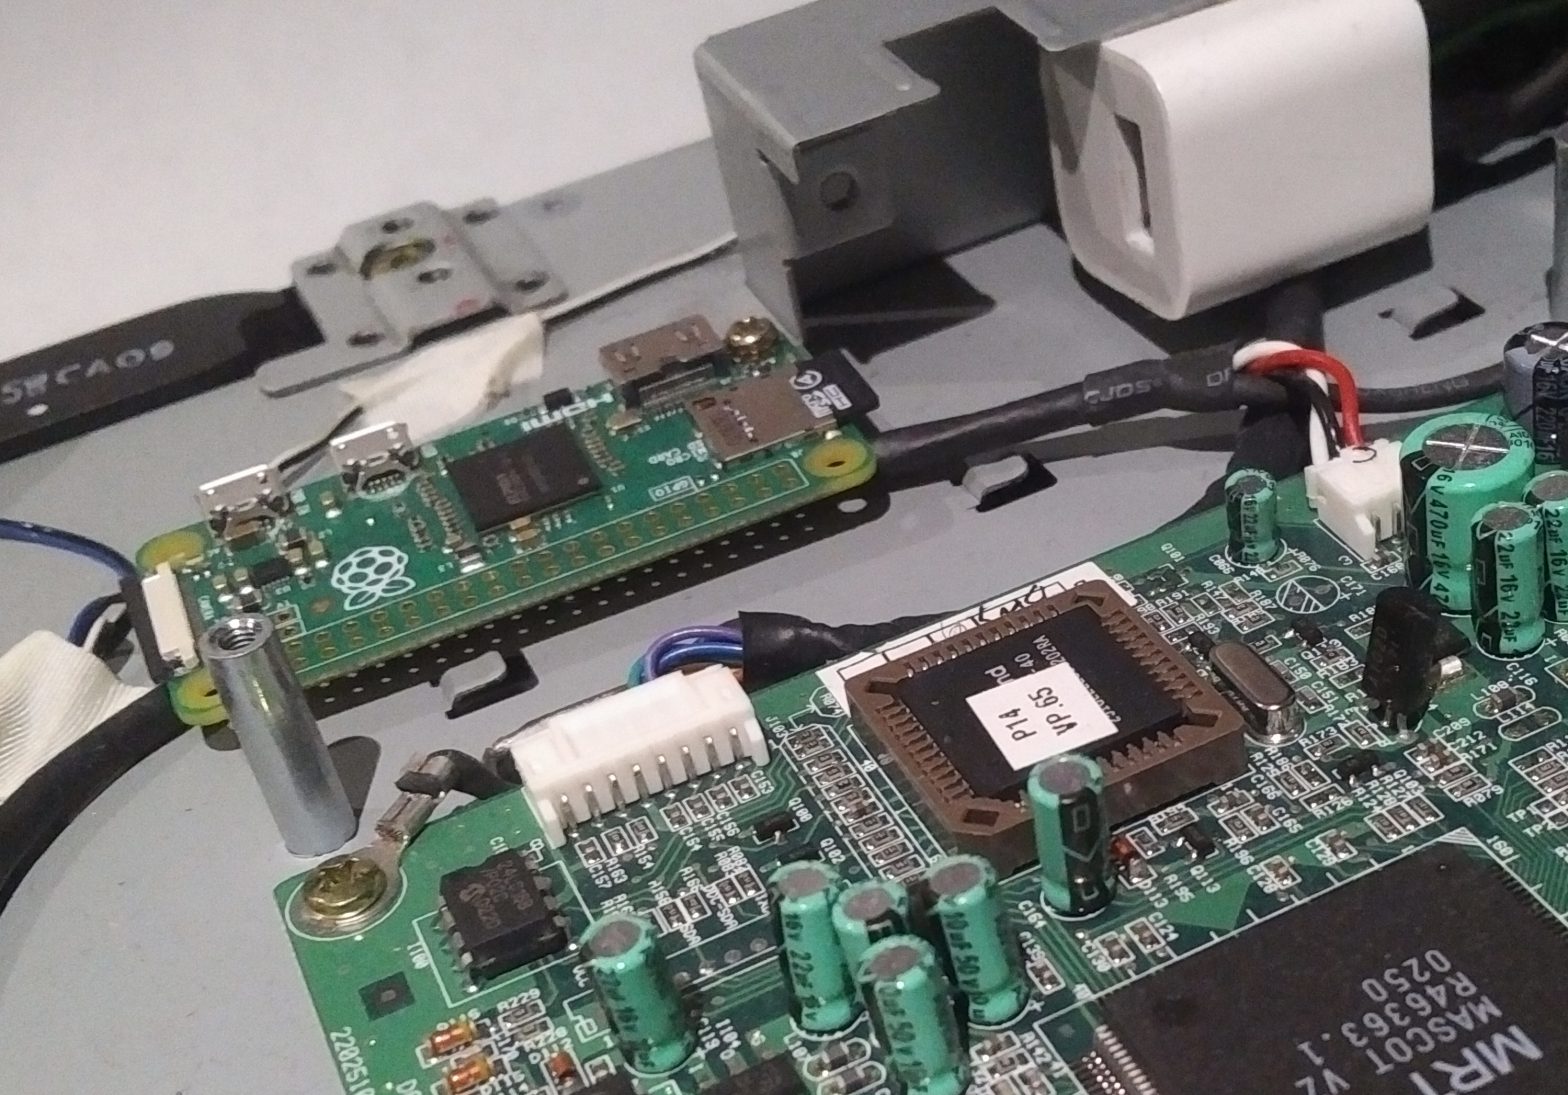
When it comes to hardware, I’ll be keeping things simple. With the exception of the monitor itself, the other complex subsystems are as follows:
Raspberry Pi Zero
USB to USB/Ethernet hub
The remaining components are internal wires/cables, which includes the Mini HDMI to VGA adapter, and 5V/1A wall adapter.
Internal Component/Wiring Diagram
Legend for above diagram: – Bolded titles are components ADDED to the vanilla monitor system. – Italicized titles are components which had to be modified in some way. – Red lines are cables which had to be modified in some way.
Component boxes nested within other component boxes are either mounted, or exist, on that component.
Let’s talk modifications
Certain cable/component modifications were pretty simple. For instance, the Mini HDMI Cable was folded at one end and held as such via some electrical tape. Other simple modifications included the Generic USB Cable used between the USB/Ethernet Hub and Pi Zero, and the Generic AUX Cable – both of which were looped and tied.
The rest were a little more complex; take the 5V/1A wall adapter for instance. I didn’t bother hacking it open because the case played a valuable role in its mounting point. Therefore to supply AC, I split the input from the Power Distribution Unit to both the unit itself and the 5V/1A wall adapter, connecting directly to the non-polarized plugs and wrapping the connection in shrink wrap.
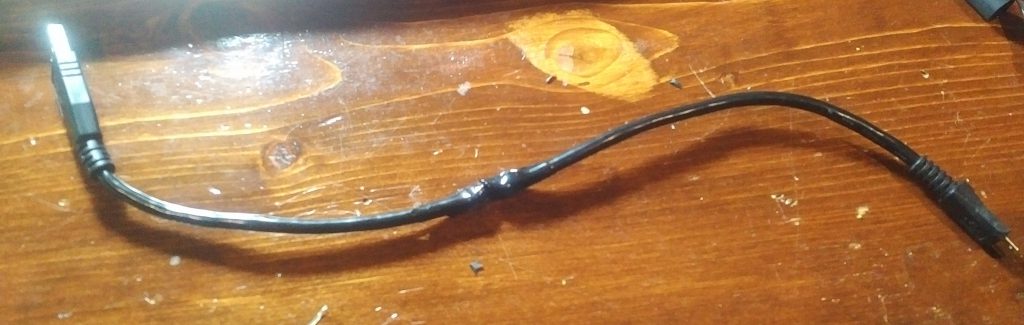
USB to USB Micro Bcable
The USB to USB Micro B cable was drastically shortened to 30cm, and rejoined via small solder joint, and shrink wrapped.
The HDMI to VGA adapter was stripped of its hideously large housing and plugged into the monitor’s VGA cable.
At this point, wiring video would be complete in a traditional monitor. However, this monitor has its VGA cable BUILT-IN. Man, was this an annoying realization. Fortunately, the other end wasn’t soldered onto the main board, and was rather some rather delicate AOpen proprietary connector.
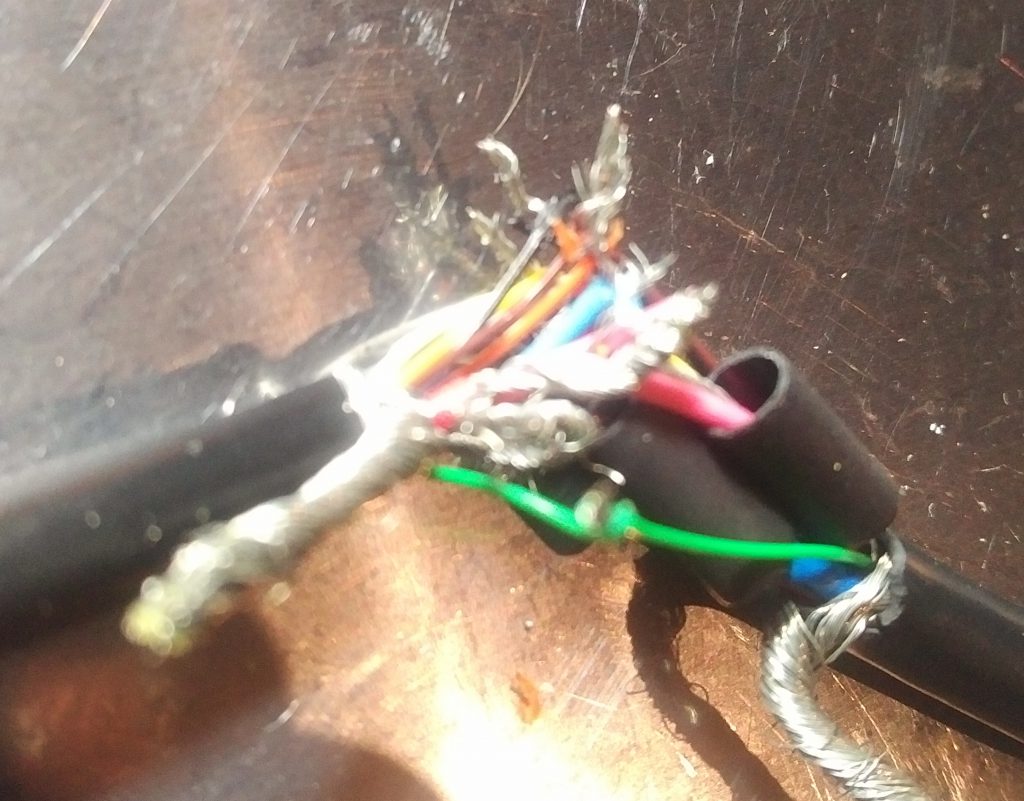
Messy SVGA cable splice (final cable after cleanup looked much better, trust me)
To ensure the integrity of this connector, I ended up splitting and shortening the built-in VGA cable to 30cm as well.
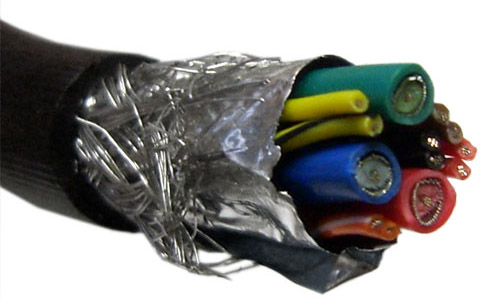
If you’ve ever wondered how all those pins in a VGA interface are sent along a single cable, I highly suggest you split a cable open to learn how. It’s an absolute beast of a cable, this particular one having a woven metal sheathe surrounding 3 coaxial-like cables and 9 wires.
Soldering individual strands was challenging enough with the variety of stranded conductors. Keeping stripped conductors from contacting was a whole new bag of worms. Hot glue came in useful for once, and helped not only hold the splice together, but keep each individual wire in place, preventing contact.
Cables connected, fingers crossed, let’s power it on
GraPi monitor, first power-on test with core components
IT’S ALIVE!
Thank the stars that this picture excludes the mess behind the monitor 😉 This covers all the core system components. We’ll be wrapping up on hardware soon – man, I can’t wait to put the rear cover back on.
We still need to talk about the USB/Ethernet Hub, and the Audio Control (both of which requiring some modifications), but we’ll leave that to the 4th GraPi post.
Creating a health dashboard by hacking intelligence into an AOpen (the ‘A’ for ancient) monitor; with metrics aggregated by Graphite and beautifully displayed with Grafana.
Let’s get some simple objectives and materials down before I change my mind. That way, I’ll have a post to update when I do.
Requirements
All hardware must be contained within the AOpen monitor.
Monitor should remain mountable.
Minimal power consumption from new hardware.
Minimal heat dissipation from new hardware.
Hardware (compute) should be sufficient to load a live Grafana dashboard.
Audio playback though integrated speakers for alarms (optional).
Creating a health dashboard by hacking intelligence into an AOpen (the ‘A’ for ancient) monitor; with metrics aggregated by Graphite and beautifully displayed with Grafana.
Background
Killing Floor 2 can be pretty fun, especially with a great crew. Not to mention the amazing community, which continues to pump out workshop content such as custom maps. With a crew assembled from players around the world, we casually run games now and then, a solid amount on custom maps.
Well, one of the servers I manage went down for some time. It wasn’t until further investigation that I discovered the host ran out of disk space with all the custom maps we’ve loaded.
It was a minor inconvenience that resulted in some down time. However, it was something that would’ve easily been foreseeable, assuming I was monitoring the host.
This made me realize something; a pretty solid chunk of services I host for both external and internal use are manually monitored.
And by that, I mean I remote into them whenever the fit hits the shan.
Nowadays, tools which help in application monitoring and insight are bountiful. It would’ve been easy enough to just pick one and deploy.
But that would be boring.
So, in combination with the need for some app. monitoring & insights, let’s build our own monitor (literally), which will be mounted on my server rack with the sole purpose of displaying a comprehensive health dashboard.
So, where we headin’?
Over the course of the next few weeks, I’ll be further covering specific goals, documenting the progress already made, ranting on my failures, and generally discussing what I’ve learned – and will learn along the way.
To make following along simple, each post dedicated to this project will not only be categorized grapi, but also have its titled numbered in order of chronology and relevance.