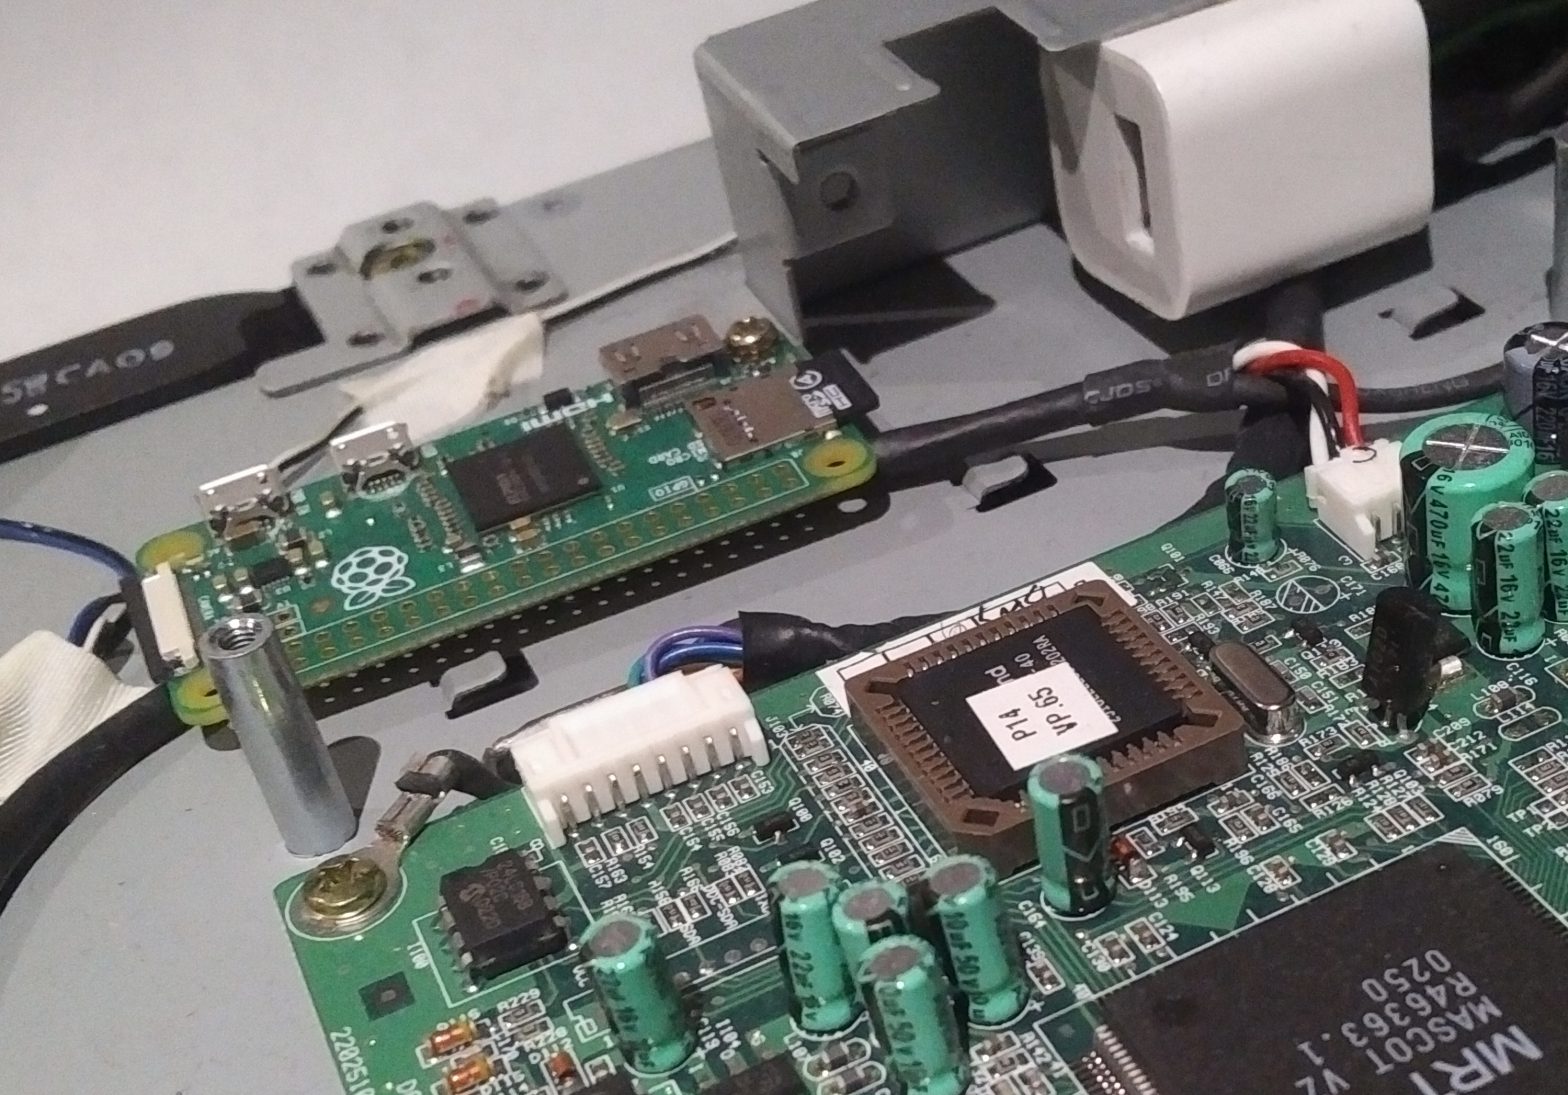
Creating a health dashboard by hacking intelligence into an AOpen (the ‘A’ for ancient) monitor; with metrics aggregated by Graphite and beautifully displayed with Grafana.
Background
Killing Floor 2 can be pretty fun, especially with a great crew. Not to mention the amazing community, which continues to pump out workshop content such as custom maps. With a crew assembled from players around the world, we casually run games now and then, a solid amount on custom maps.
Well, one of the servers I manage went down for some time.
It wasn’t until further investigation that I discovered the host ran out of disk space with all the custom maps we’ve loaded.
It was a minor inconvenience that resulted in some down time. However, it was something that would’ve easily been foreseeable, assuming I was monitoring the host.
This made me realize something; a pretty solid chunk of services I host for both external and internal use are manually monitored.
And by that, I mean I remote into them whenever the fit hits the shan.
Nowadays, tools which help in application monitoring and insight are bountiful. It would’ve been easy enough to just pick one and deploy.
But that would be boring.
So, in combination with the need for some app. monitoring & insights, let’s build our own monitor (literally), which will be mounted on my server rack with the sole purpose of displaying a comprehensive health dashboard.
So, where we headin’?
Over the course of the next few weeks, I’ll be further covering specific goals, documenting the progress already made, ranting on my failures, and generally discussing what I’ve learned – and will learn along the way.
To make following along simple, each post dedicated to this project will not only be categorized grapi, but also have its titled numbered in order of chronology and relevance.