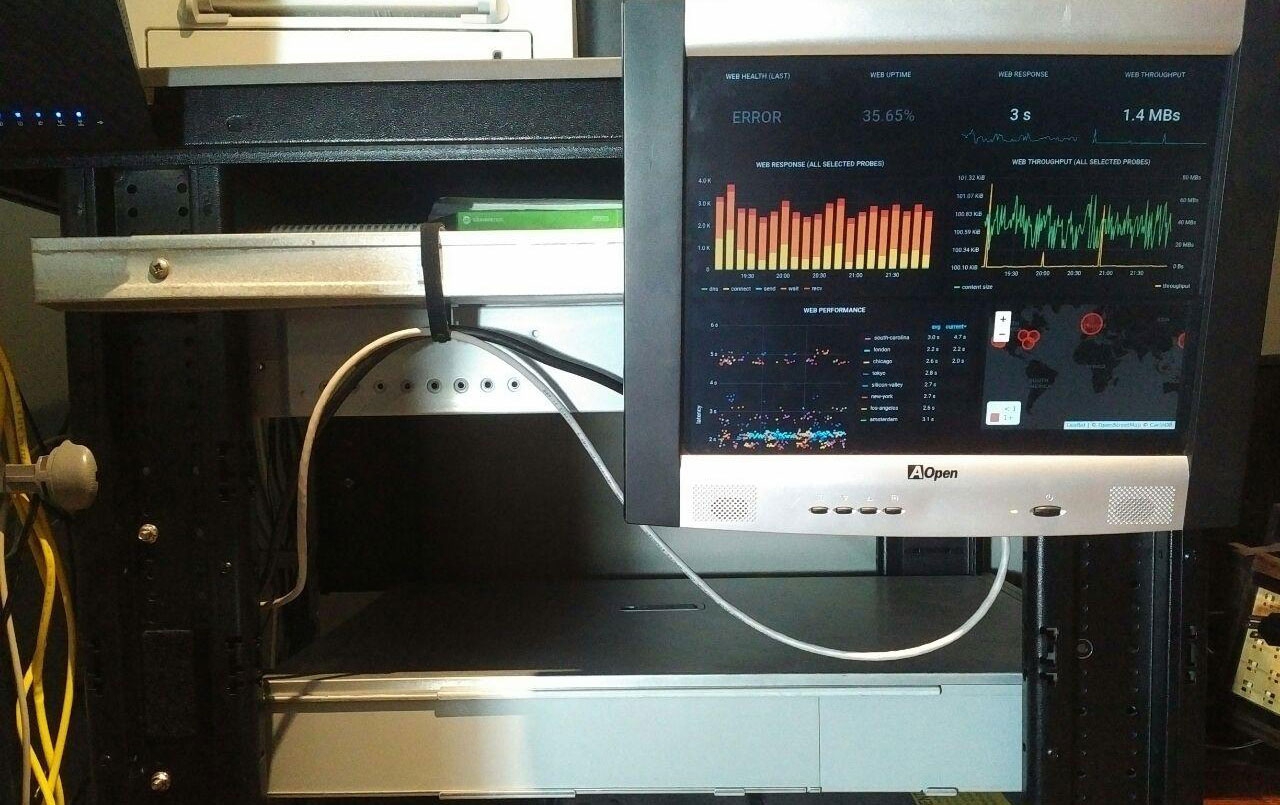
Creating a health dashboard by hacking intelligence into an AOpen (the ‘A’ for ancient) monitor; with metrics aggregated by Graphite and beautifully displayed with Grafana.
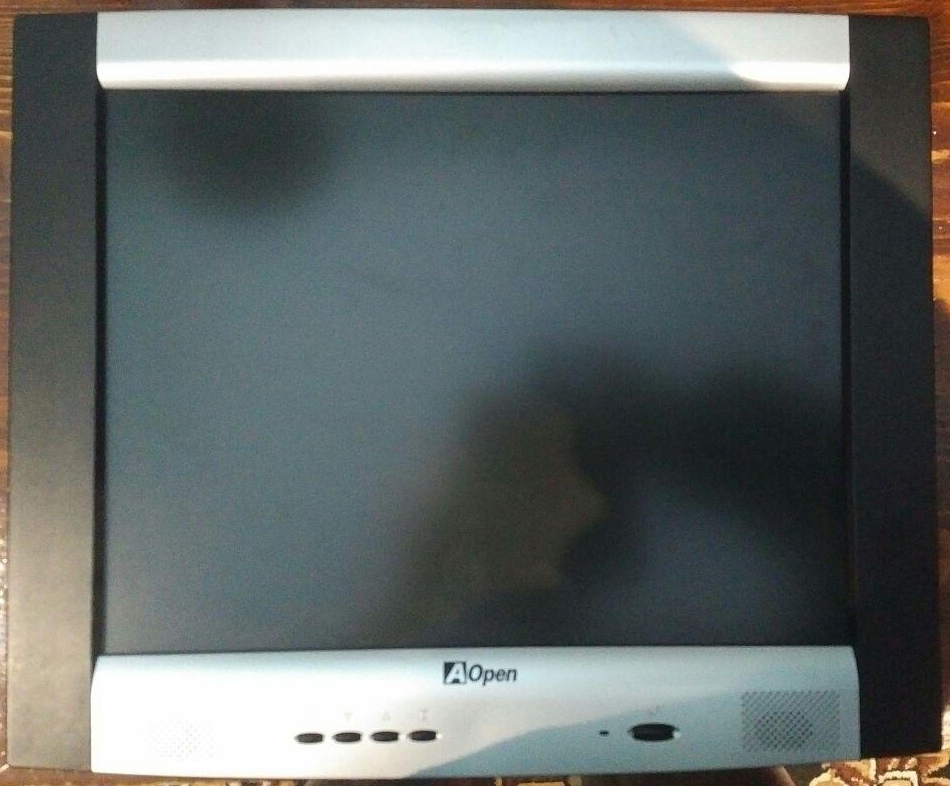
Front of GraPi Kiosk 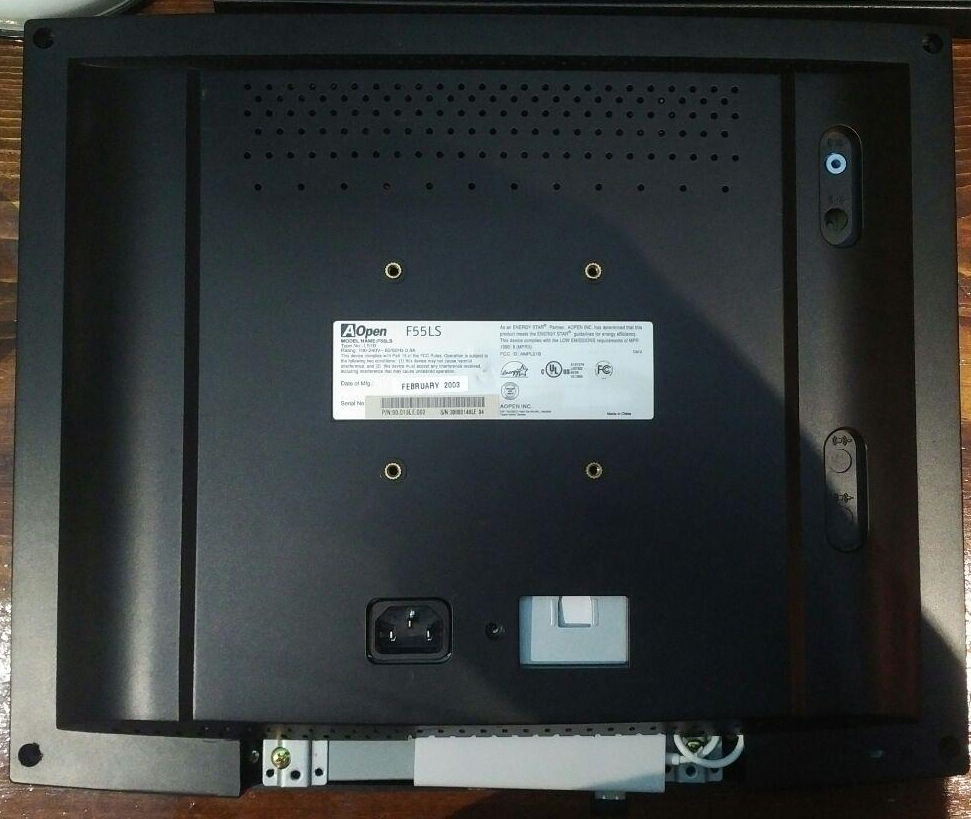
Rear of GraPi Kiosk – note there’s only two connections needed; power and Ethernet 
Mounted on a horizontal sliding rail, cables temporarily strung up with Velcro


This marks the completion of hardware needed for the GraPi system – our AOpen monitor now functioning as a smart Kiosk.
Minor mishap; realized at the end that the USB/Ethernet Hub’s mounting orientation results in the Ethernet port to the RIGHT of the monitor rather than the left.
However, I’m planning to hide these cables within the rail, so once the Ethernet cable gets pulled behind the monitor, it shouldn’t be noticeable.
You might be able to notice from the images above, but we do have a working Graphite & Grafana setup running – something I’ve been working on alongside all this, and will be discussing in the future.
The metrics seen are an example, with data from WorldPing targeting a friend’s server in the states – the purpose being to illustrate a loaded Grafana dashboard.
From here on out, it’s all software.
In the next few posts, we’ll cover setup of Graphite and Grafana on Ubuntu Server, followed by setting up a Grafana dashboard kiosk on Raspbian Lite.
I benefit from browsing your internet site. Thank you!